学为贵雅思培训-北京雅思培训班哪家好项目部提供:雅思写作必背40篇范文:经典曲线图。
一篇雅思写作必背40篇范文:经典曲线图教你搞定曲线图的词汇、句型、特征挑选、分析对比!涨分的信息都在这篇文章中,赶紧背起来吧~

通过范文学习:
1.如何寻找主要特征:
2.时间到了将来应该如何表达:
3.如何在描述中做到对比:
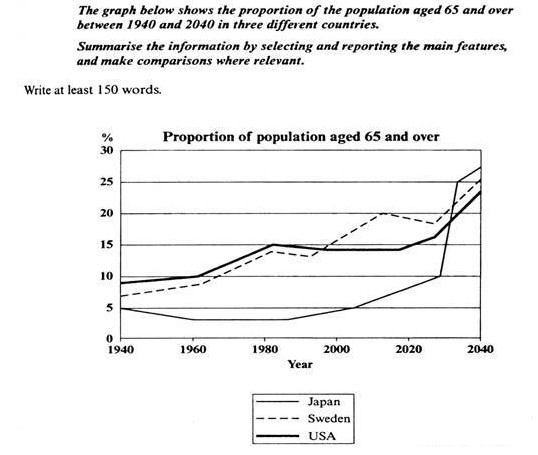
The line graph shows the proportion of people in Japan, Sweden, and USA aged 65+ from 1940 and the expected proportions up to 2040.
From 1940 to 1990, the proportions of people aged 65+ in the USA and Sweden were similar and followed the same trend. In 1940 the figures were 9% and 7% respectively, rising to15% and 14% respectively in 1980, before dipping to 14% and 13% respectively in 1990. Thereafter, American's proportion of people aged 65+ leveled out and is forecast to remain at 14% until 2020, after which it is expected to increase to 23% in 2040. However, Sweden's proportion of people aged 65+ began to rise until 2010 when the proportion was 20%. Then, there is expected to be a slight drop to 18% in 2030, followed by a steep climb to 25% in 2040.
The situation in Japan differs considerably, with a fall in the percentage of people aged 65+ between 1940 (5%) and 1960 (3%)。 The percentage remained steady until 1985, where upon it began to climb. This rise is projected to continue until around 2030, when the proportion of Japanese aged 65+ is expected to reach 10%. Thereafter, within just a few years, the proportion is forecast to rise dramatically to 25%, with a less dramatic rise to 27% in 2040.
(本篇经典曲线图写作范文由朱宏老师提供)
最后预祝广大考生都能早日屠鸭成功!

更多雅思资讯,请关注学为贵教育官网!届时,小贵贵将为广大贵粉们提供准确、及时、专业的雅思信息。

 北京
北京
 400-6236-898


 官方微信
官方微信
 官方微博
官方微博